
Bitcoin Touched $85,000 and Gave It All Back in a Day, and Both Sides Got Hurt

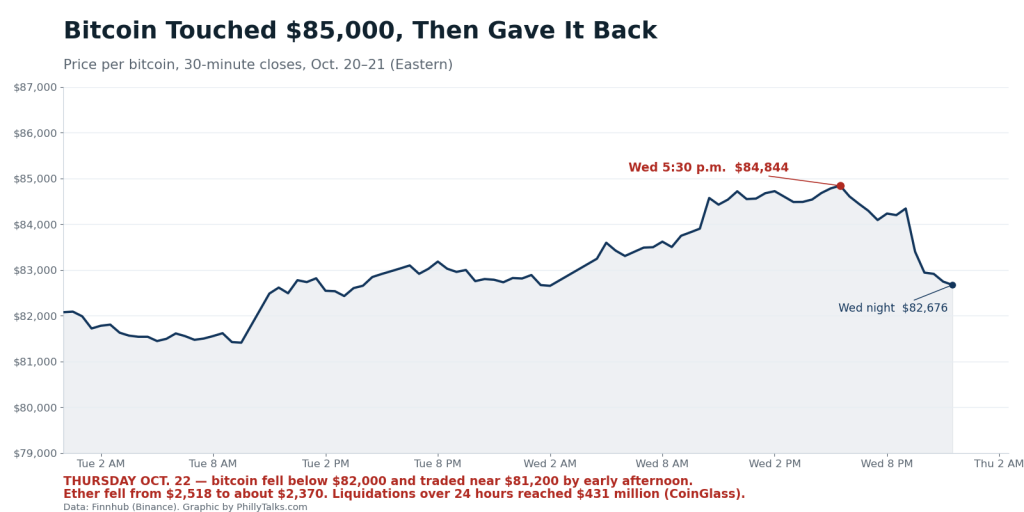
New York — Bitcoin slid from the edge of $85,000 to the $81,000 range in about half a day. The reasons for the rise were clear, and the reasons for the fall were clear, but the two moves arrived within hours of each other, and traders using borrowed money were forced out on the way up and again on the way down. CoinDesk, Bloomberg and TradingKey reported the move on Oct. 22.
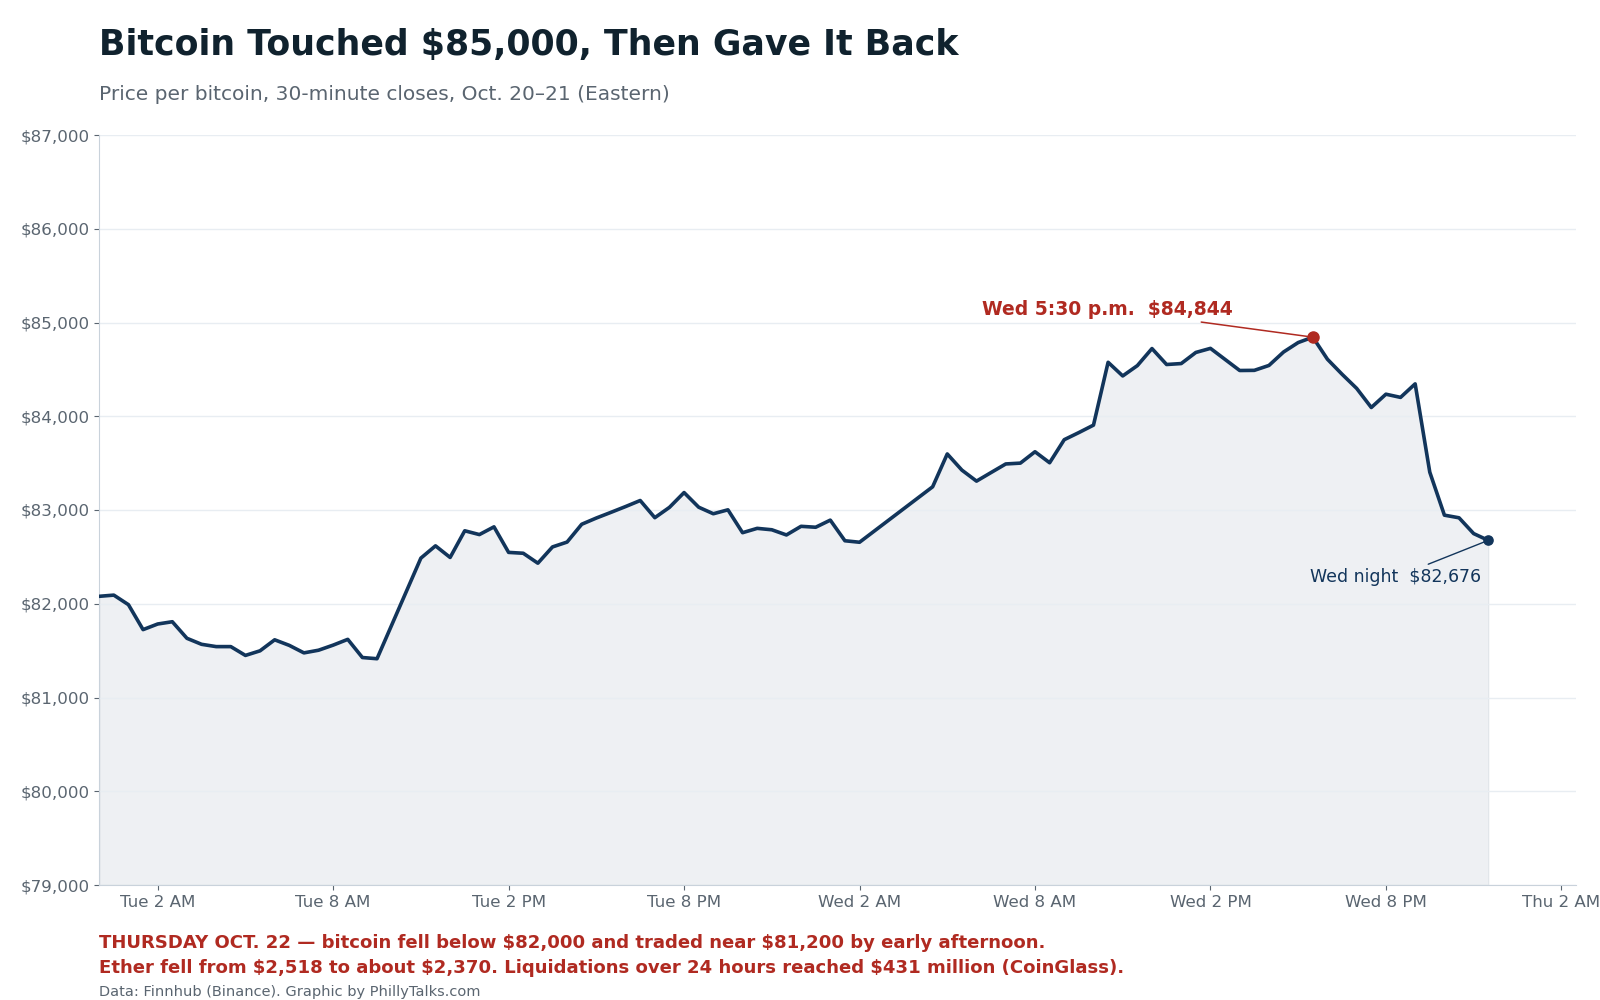
Late Wednesday, bitcoin rose past $84,800, its highest level in about two weeks. Ether broke above $2,500. By Thursday, the gains were gone. Bitcoin fell below $82,000 to trade near $81,100, and ether slipped to about $2,370, a drop of nearly 6 percent. The CoinDesk DeFi index fell 5.6 percent, and smaller coins fell harder than the largest ones.
The liquidations hurt more than the price move itself. CoinGlass counted $431 million in positions liquidated over 24 hours, across more than 100,000 traders. During the climb, $173 million was liquidated from short positions, bets that the price would fall. During the reversal, $210 million of the $222 million liquidated in the most recent 12 hours came from long positions, bets that it would rise. The largest single hit was an $11.8 million bitcoin long position on Binance, closed near $83,500, CoinDesk reported.
Why liquidations hurt both sides
In futures trading, positions are taken with borrowed money. When the price moves against a trader and the margin runs short, the exchange closes the position by force. That forced closing is a liquidation. Forced selling pushes a decline further down, and forced buying lifts a rally higher. When a sharp rise is followed by a sharp fall, the shorts are hit first and the longs who arrived late are hit next, passing through the same ground twice. The $3,000 round trip followed exactly that structure.
The rise had its reasons
Institutional money fueled the climb. United States spot bitcoin exchange-traded funds took in more than $1 billion over the first three days of the week, according to SoSoValue data, after $909.6 million had flowed out over the previous two weeks, so the turn in direction itself read as a signal. When the price touched a two-week high, short positions were liquidated and the climb gathered speed. Sentiment had already tilted toward optimism, with a fear and greed reading of 68.
The break came from outside crypto
The trigger for the reversal was pulled in the stock market, not inside crypto. Mixed results from Meta and Tesla revived doubts about artificial intelligence spending, and Nasdaq 100 futures fell more than 1.3 percent. In Asia, Hong Kong’s Hang Seng index fell more than 3 percent, South Korea’s Kospi lost 3.5 percent and Japan’s Nikkei slipped 2.7 percent.
Oil added to the pressure. Brent crude rose above $110 a barrel after Houthi attacks on Saudi Arabia, and on oil-driven inflation concern, United States Treasury yields rose and the dollar strengthened. TradingKey said inflation data that came in higher than expected had clouded expectations for Federal Reserve rate cuts, and that with yields and the dollar rising together, investors around the world moved to cut borrowed positions. When risk comes off the table, the most volatile asset is sold first, and crypto sits in that seat.
Money is coming in, so why can it not hold
This is the point investors find most frustrating. Institutional money is entering through the funds and the price still cannot hold, so the signals appear to contradict each other. Split the money by size and the picture changes. TradersUnion noted that during bitcoin’s past strong rallies, the spot funds took in an average of $235 million a day, while the average since July has been $86 million a day. The money has returned, but not yet at the strength that sustained earlier rallies.
Leverage sits on top of that. Spot money arrives slowly while futures bets stack up quickly, and once the price moves a few thousand dollars in one direction, one liquidation calls the next. Information pointing the right way and a structure that shakes the price are working at the same time, which is how a trader can read the news correctly and still lose money on the day.
The next checkpoints are already set
For now, the material that moves crypto sits outside crypto. The Federal Reserve meets on Oct. 28, and Alphabet and Microsoft report results the same day, with the scale of their artificial intelligence capital spending at the center. When two more answers join the question that started with Meta, the direction for technology stocks, and for crypto alongside them, could come into clearer view. Weekly jobless claims in the United States, released Thursday, were a nearer-term input.
On price, the $82,500 level is being cited as the fork in the road. CoinDesk reported that some market watchers see a break below it opening a path toward $70,000. Bitcoin remains about 34 percent below its record high of $126,080. Until a direction is set, it is the kind of market where a round trip like this one can repeat.